- Data through Monday, 6/26/23
- Next update: Wednesday, 7/12/23
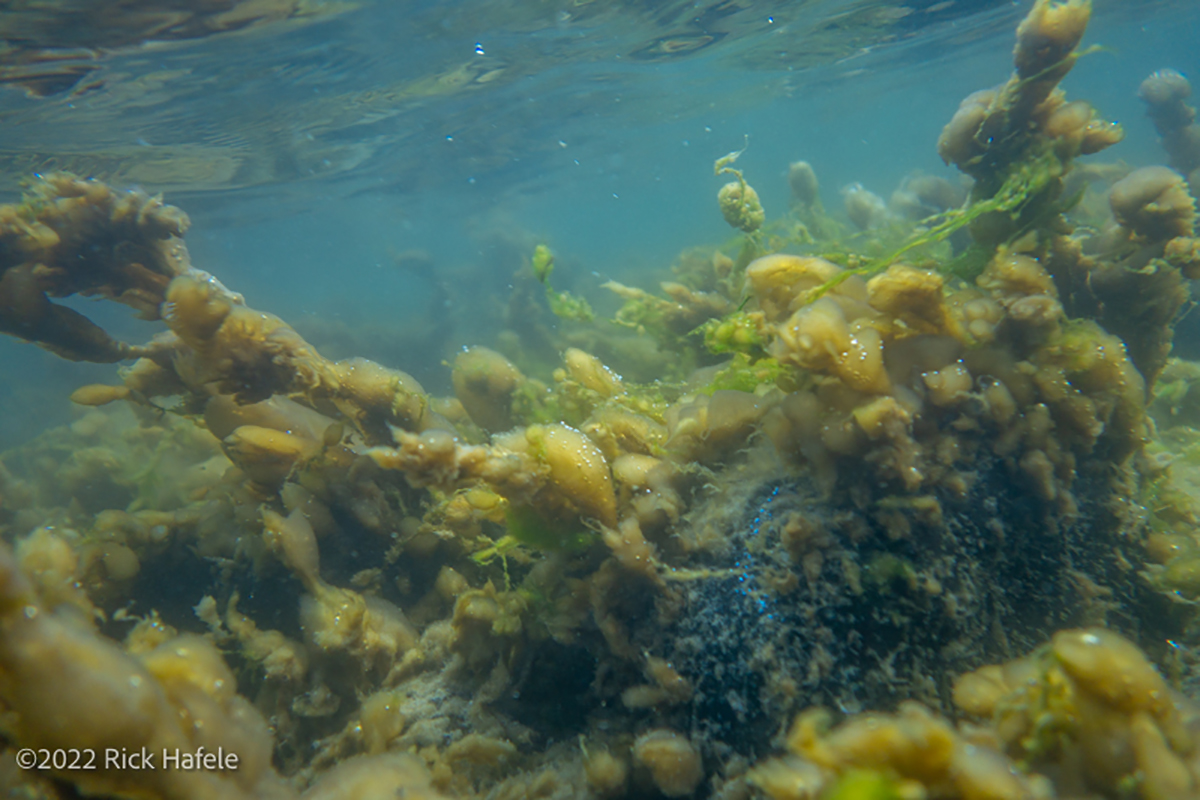
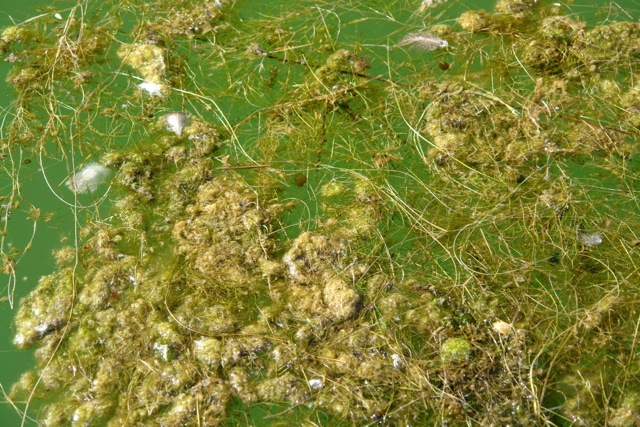
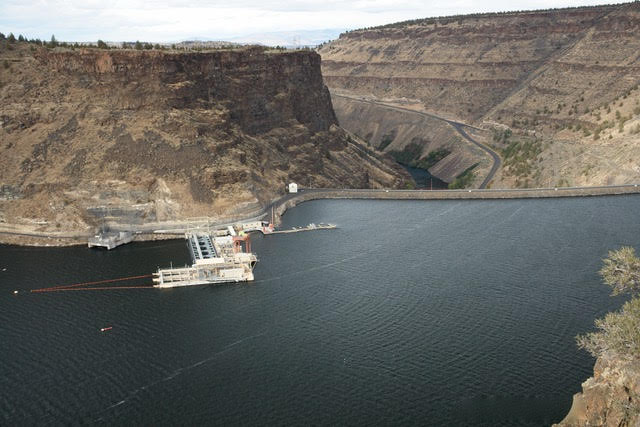
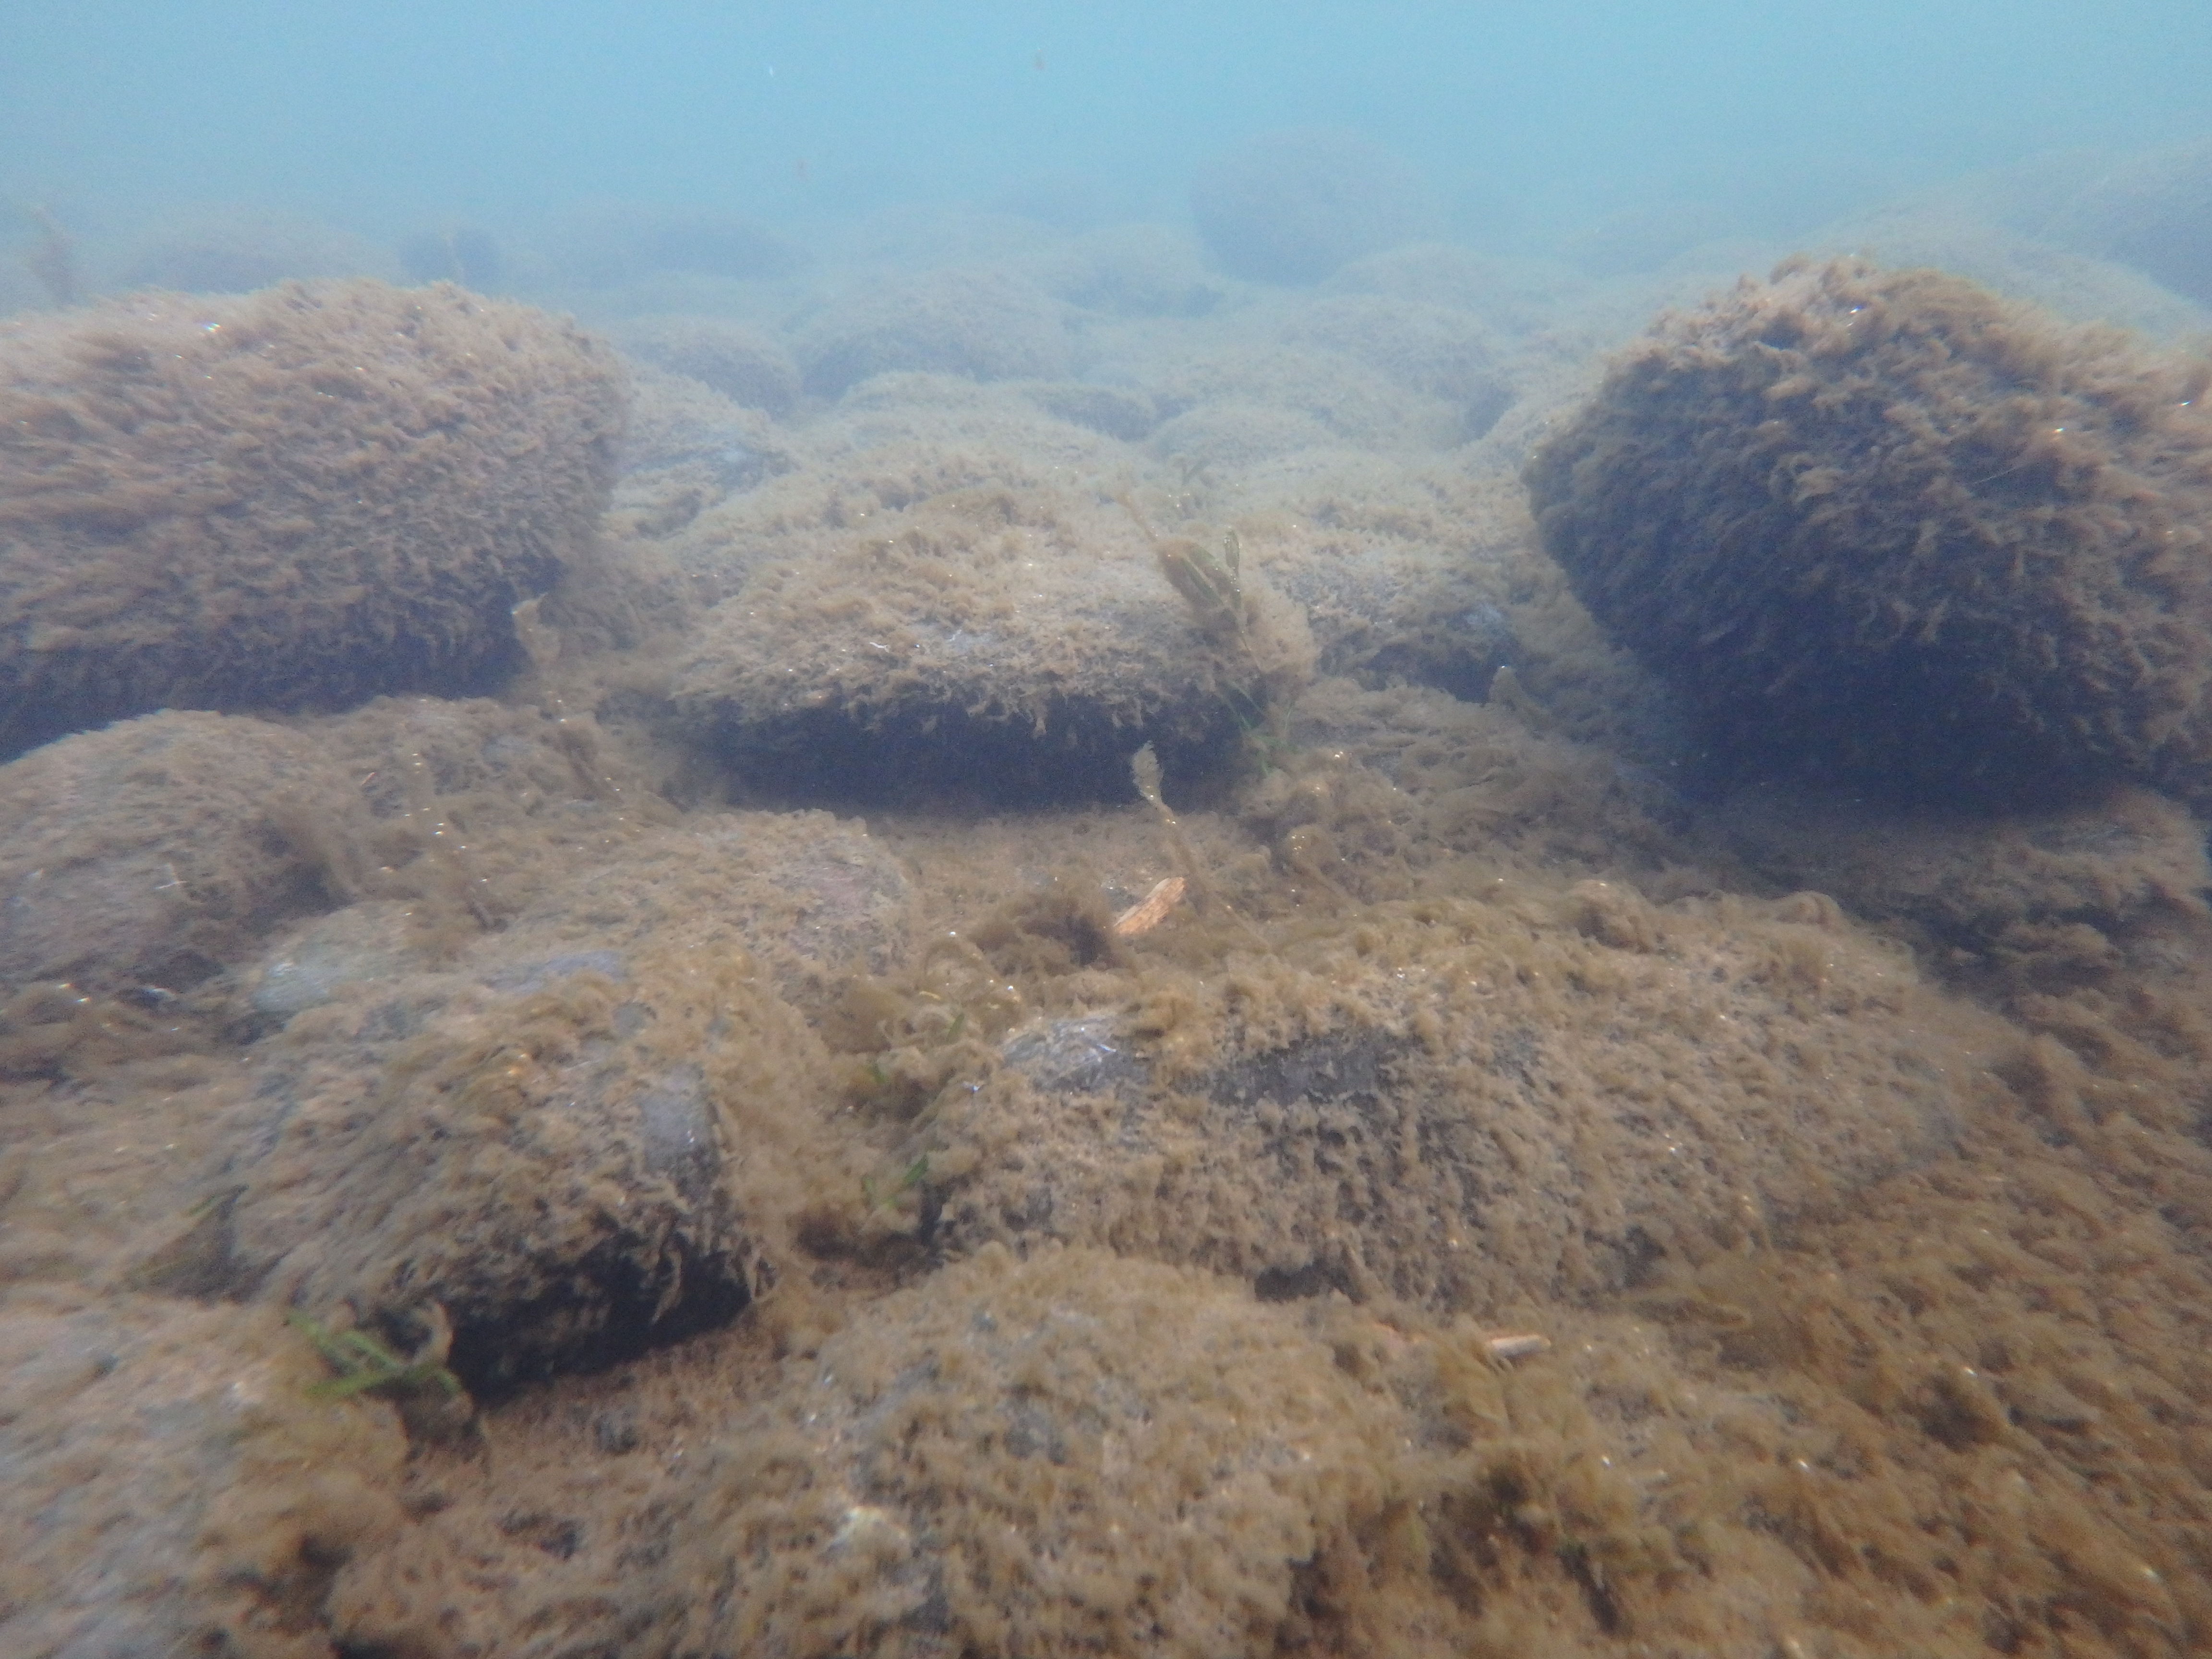
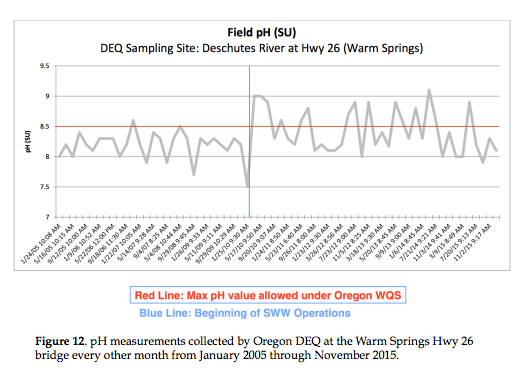
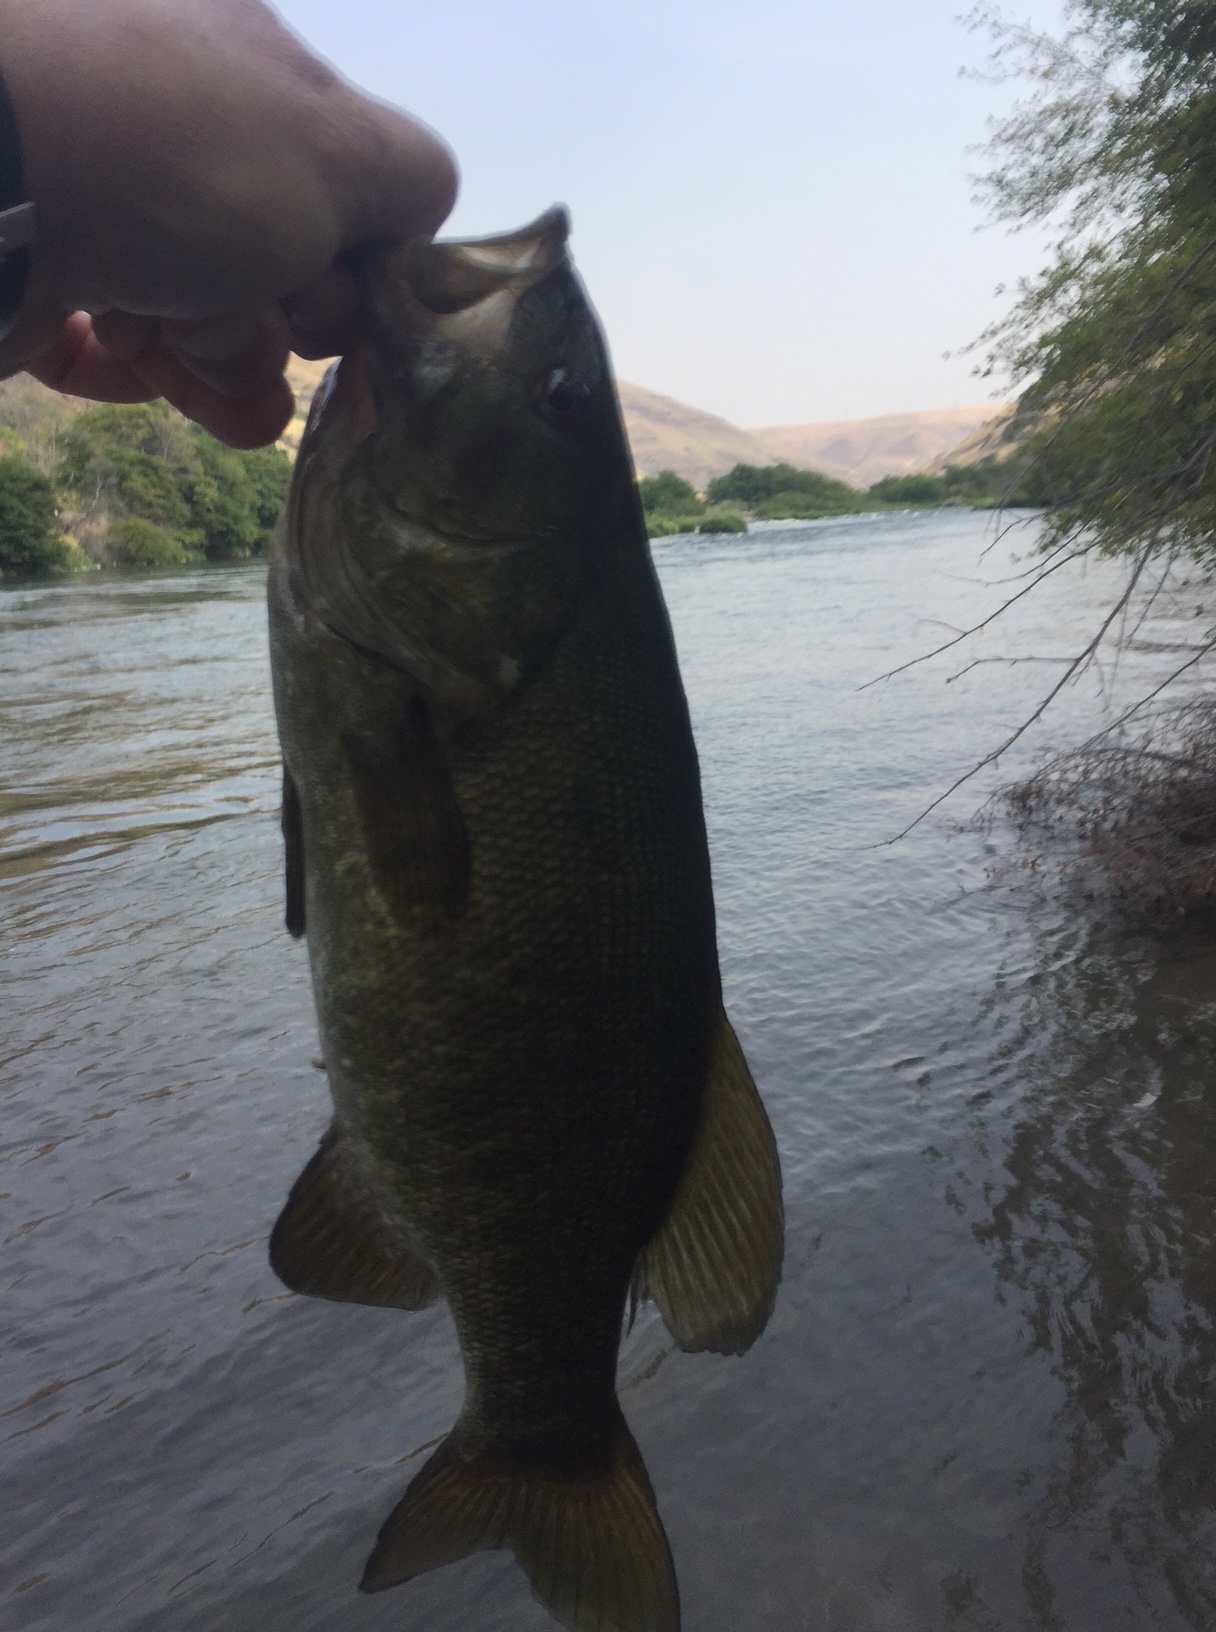
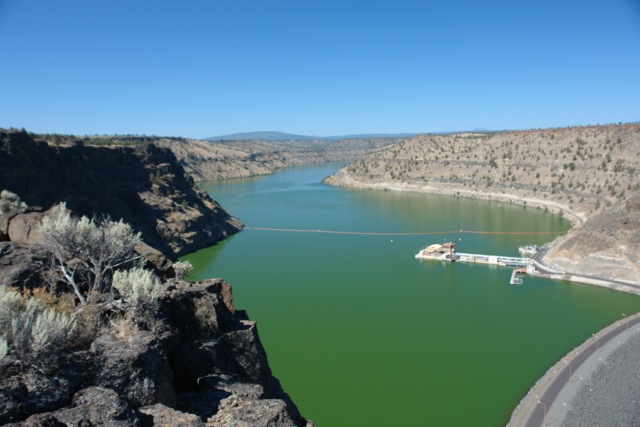
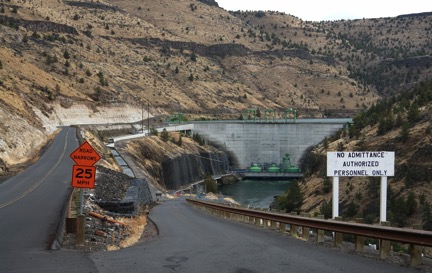
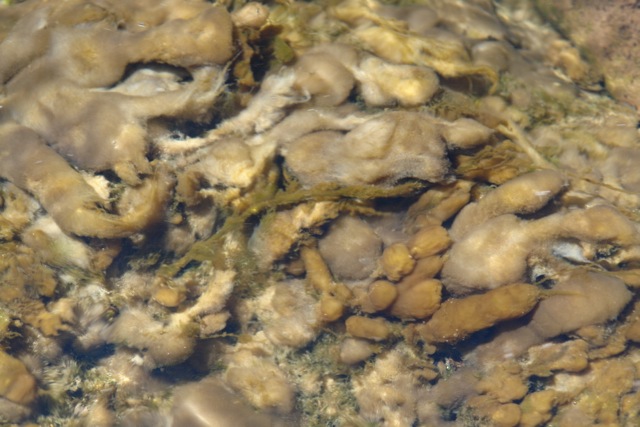
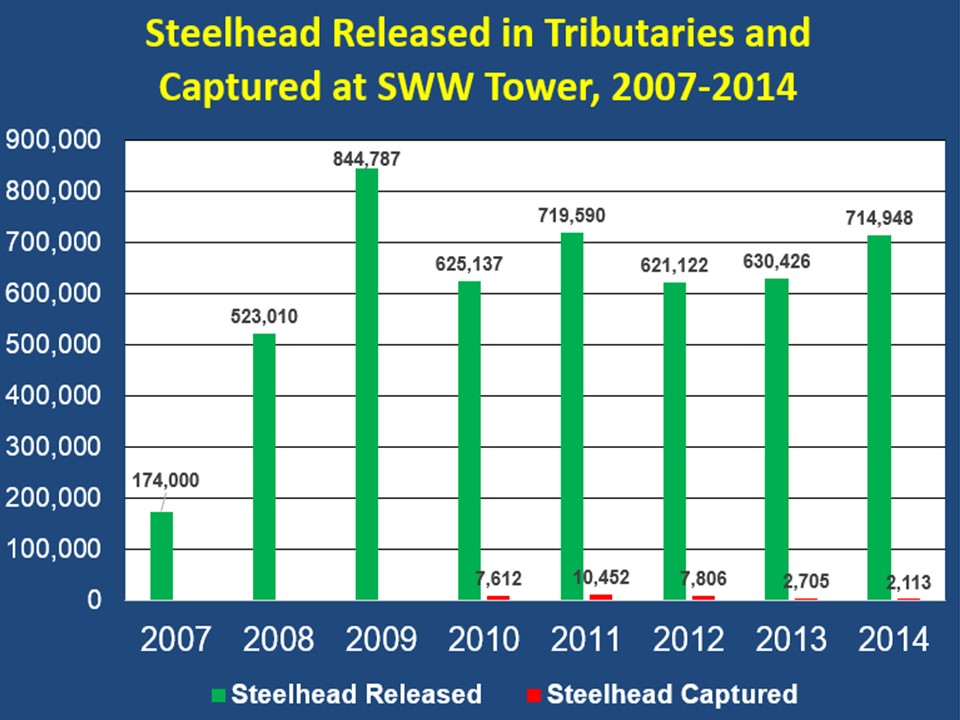
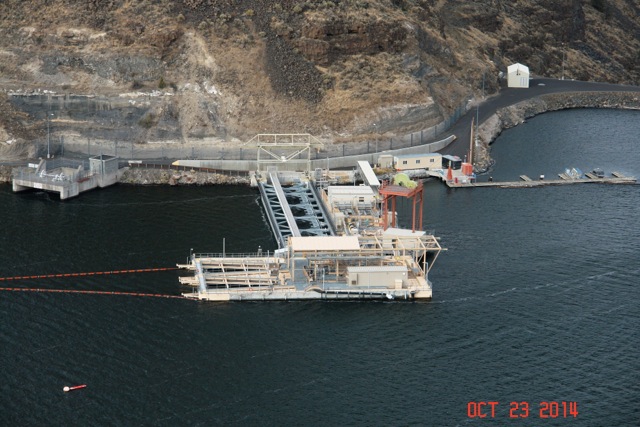
Since PGE constructed the Selective Withdrawal (SWW) Tower in Lake Billy Chinook in 2009, the number of water quality standard violations have increased. This is representative of the negative shifts that have been observed in the lower Deschutes River following tower operations, including the increased abundance of nuisance algae, decline in sensitive aquatic insect abundance and shift in emergence, and increased prevalence of fish disease and parasites.
Summary:
This document will be updated on a weekly basis to report on the current conditions in the lower Deschutes River. It includes water quality conditions at each of our two monitoring sites near Warm Springs and Maupin, weekly flow snapshots from the USGS Madras and Moody gauges, and an update on the latest aquatic insect hatches occurring throughout the river based on entries we receive from the public on our Aquatic Insect Hatch App. Please consider keeping your fellow anglers informed by making entries to our hatch app while you are on the lower river!
Directly below is a summary table of pH, dissolved oxygen (DO) and temperature at our two monitoring stations to date for the 2023 monitoring season:
| Near Warm Springs: Summary of Water Quality Violations | |||
| pH | DO | Temperature | |
| # Days Monitored | 81 | 81 | 81 |
| # of of Days Violating Standard | 81 | 0 | 18 |
| Maupin: Summary of Water Quality Violations | |||
| # of Days Monitored | 39 | 39 | 39 |
| # of Days Violating Standard | 38 | 0 | 0 |
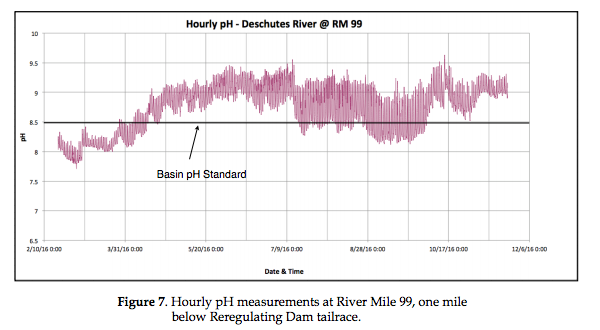
Note that there have been daily violations of the pH standard in the lower Deschutes for the duration of our monitoring thus far in 2023, which has unfortunately been a common occurrence since the DRA started continuous water quality monitoring in the lower Deschutes back in 2016.
Public Portal:
You can view the current water quality conditions at each of our two monitoring sites on our Public Portal. Conditions are updated every 10 minutes.
Outline:
The following data will be provided in this weekly update:
- Water quality update:
- Tables 1-2 provides an overview of the water quality violations for pH, temperature, and dissolved oxygen (DO) observed by the DRA in the lower Deschutes River at our two monitoring stations so far during the 2023 monitoring season.
- Figures 1 – 10 depict current graphs of temperature, dissolved oxygen (DO) and pH at our two monitoring stations during the 2023 monitoring season
- Flow update: Figures 11 -12 depict the last thirty days of flow data from the USGS Madras (near Warm Springs) and Moody (near the mouth) gauges in the lower Deschutes
- Aquatic insect hatch data: Table 3 summarizes the most recent hatches occurring on the lower Deschutes based on entries received from our aquatic insect hatch app
For Additional information:
Our Public Portal Help Sheet contains the following:
- How to use the Public Portal
- Additional background information
- What the aquatic life use designations mean
- What the water quality standards are in the lower Deschutes and why they are important
For more information on how the river ecosystem has changed in the lower Deschutes following SWW Tower operations as a result to declining water quality, please read our annual 2022 Lower Deschutes River Water Quality Report, or watch our recent State of the Lower Deschutes webinar.
Water Quality Update
| Near Warm Springs: # Days of Violations by WQ Standard Monitoring Started 3/15/2023 | ||||||
| Parameter | Beneficial Use | Min/Max | Standard | Date Range | Total Days of Violations – 2023 | Out of (Days Monitored) |
| pH | aquatic life | Maximum | 8.5 absolute max | All year | 81 | 81 |
| Temp | spawning | Maximum | 13 °C 7-DADM | Jan 1 – Jun 15, Oct 15 – Dec 31 | 18 | |
| Temp | core cold- water | Maximum | 16 °C 7-DADM | Jun 16 – Oct 14 | 0 | |
| DO | spawning | Minimum | *9.0 mg/L Abs Min | Jan 1 – Jun 15, Oct 15 – Dec 31 | 0 | |
| Key: 7-DADM = Seven-day average daily maximum, or the maximum of seven consecutive-day floating average of the daily maximum temperature *Note that the 9.0 mg/L absolute minimum standard during the salmon/steelhead spawning and incubation period applies since intergravel DO studies were performed by PGE shows that adequate (at least 8.0 mg/L) IGDO is present. If this were not the case, the higher standard of 11.0 mg/L 7-day mean minimum would apply. | ||||||
| Maupin: # Days of Violations by WQ Standard Monitoring Started: 4/26/2023 | ||||||
| Parameter | Beneficial Use | Min/Max | Standard | Date Range | Total Days of Violations – 2023 | Out of (Days Monitored) |
| pH | aquatic life | Maximum | 8.5 absolute max | All year | 38 | 39 |
| Temp | spawning | Maximum | 13 °C 7-DADM | Jan 1 – May 15, Oct 15 – Dec 31 | 0 | |
| Temp | salmon/ trout rearing/ migration | Maximum | 18 °C 7-DADM | May 16 – Oct 14 | 0 | |
| DO | spawning | Minimum | *11.0 mg/L 7-D Min | Jan 1 – May 15, Oct 15 – Dec 31 | 0 | |
| Key: 7-DADM = Seven-day average daily maximum, or the maximum of seven consecutive-day floating average of the daily maximum temperature 7-D = 7-day mean minimum, or the minimum of seven consecutive-day floating average of the calculated daily mean dissolved oxygen concentration *Note that the higher standard of 11.0 mg/L 7-day mean minimum applies at the Maupin site since no IGDO stuides have been performed in this portion of the river to date. | ||||||

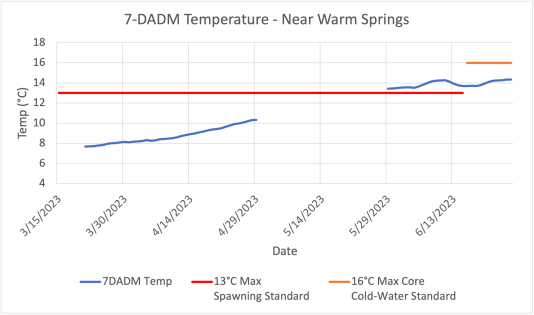
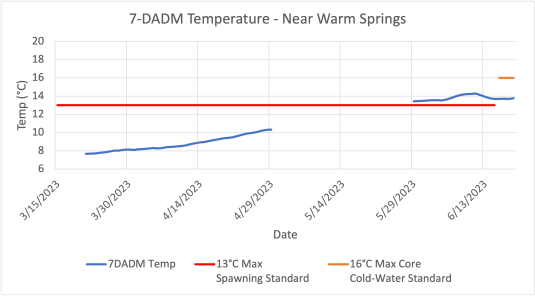
Figures 1 – 2. Instantaneous temperature (top) and rolling 7-day average daily maximum (7-DADM) temperature (bottom) at the Warm Springs site depicted by the blue lines in the two graphs above. The rolling 7-DADM temperature is what is applied for the temperature standards throughout Oregon. Red line in bottom graph depicts the maximum 13 °C standard that applies during the designated salmon/steelhead spawning period of October 15 – June 15 at this site. Orange line depicts the maximum 16 °C core cold-water standard that applies June 16 – October 14 at this site. Note the violation of the temperature standard at the Warm Springs site from 5/30/23 to 6/15/23.


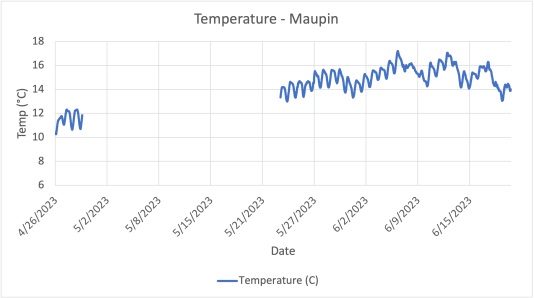
Figures 3 -4. Instantaneous temperature (top) and rolling 7-day average daily maximum (7-DADM) temperature (bottom) at the Maupin site depicted by the blue lines in the two graphs above. The rolling 7-DADM temperature is what is applied for the temperature standards throughout Oregon. Orange line depicts the maximum 18 °C salmon/trout rearing and migration standard that applies May 16 – October 14 at this site. The salmon/steelhead spawning period is designated October 15 – May 15 at this site. The first 7-DADM data point did not occur until May 29, which why the spawning standard is not included in the bottom graph.


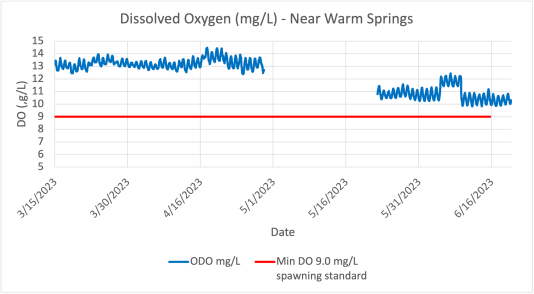
Figures 5-6. Dissolved oxygen concentration in mg/L near Warm Springs (top) and Maupin (bottom) is depicted by blue lines in the two graphs above. The absolute minimum 9.0 mg/L dissolved oxygen standard that applies during the salmon/steelhead spawning periods are depicted by the red lines. Spawning period is October 15 – June 15 at the Warm Springs site and October 15 – May 15 at the Maupin site. Note that there was not enough data collected at the Maupin site during the spawning season (3 days, 7 days needed) to calculate the 7 day mean minimum.
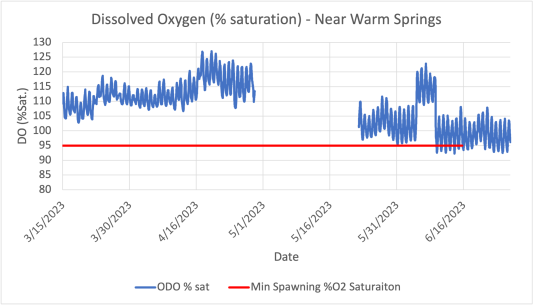

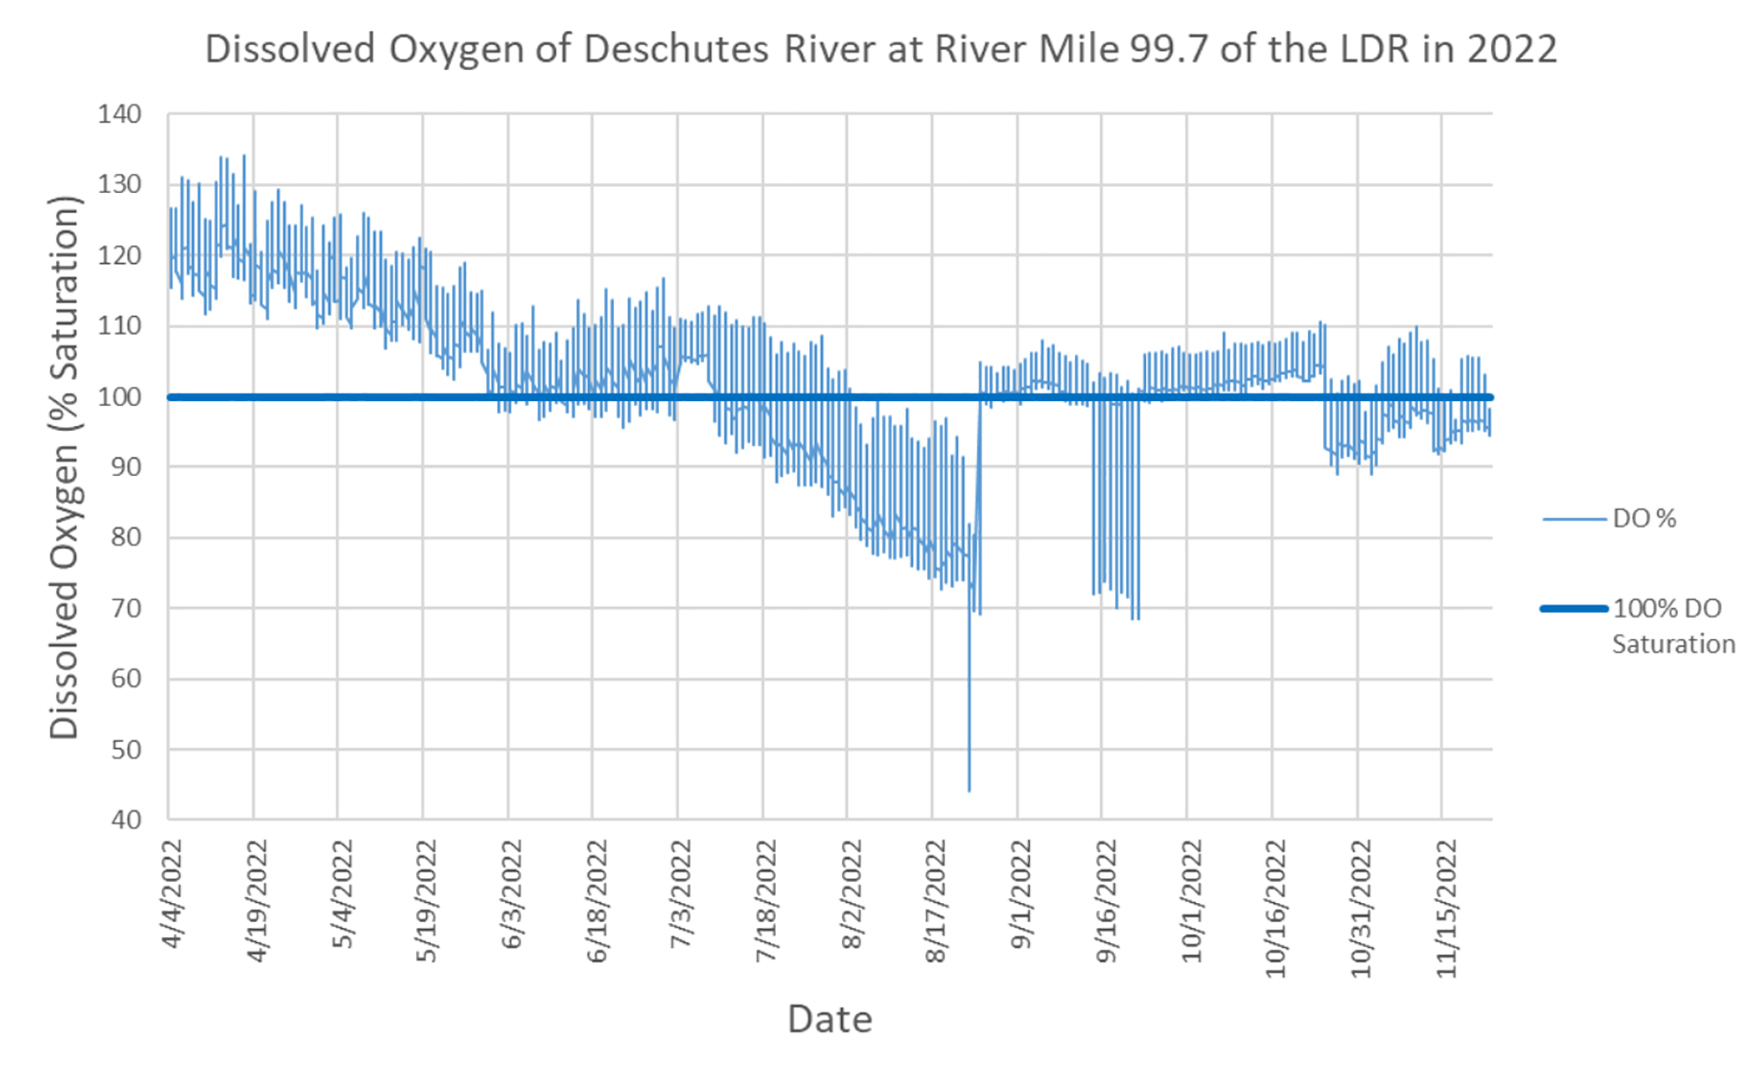
Figures 7-8. Dissolved oxygen concentration in percent saturation near Warm Springs (top) and Maupin (bottom) depicted by the blue lines in the two graphs above. The absolute minimum 95% mg/L dissolved oxygen saturation that applies during the salmon/steelhead spawning periods are depicted by the red lines. Note that this standard only applies if conditions of barometric pressure, altitude, and temperature preclude achievement of the 9.0 or 11.0 mg/L standards. Spawning period is October 15 – June 15 at the Warm Springs site and October 15 – May 15 at the Maupin site.


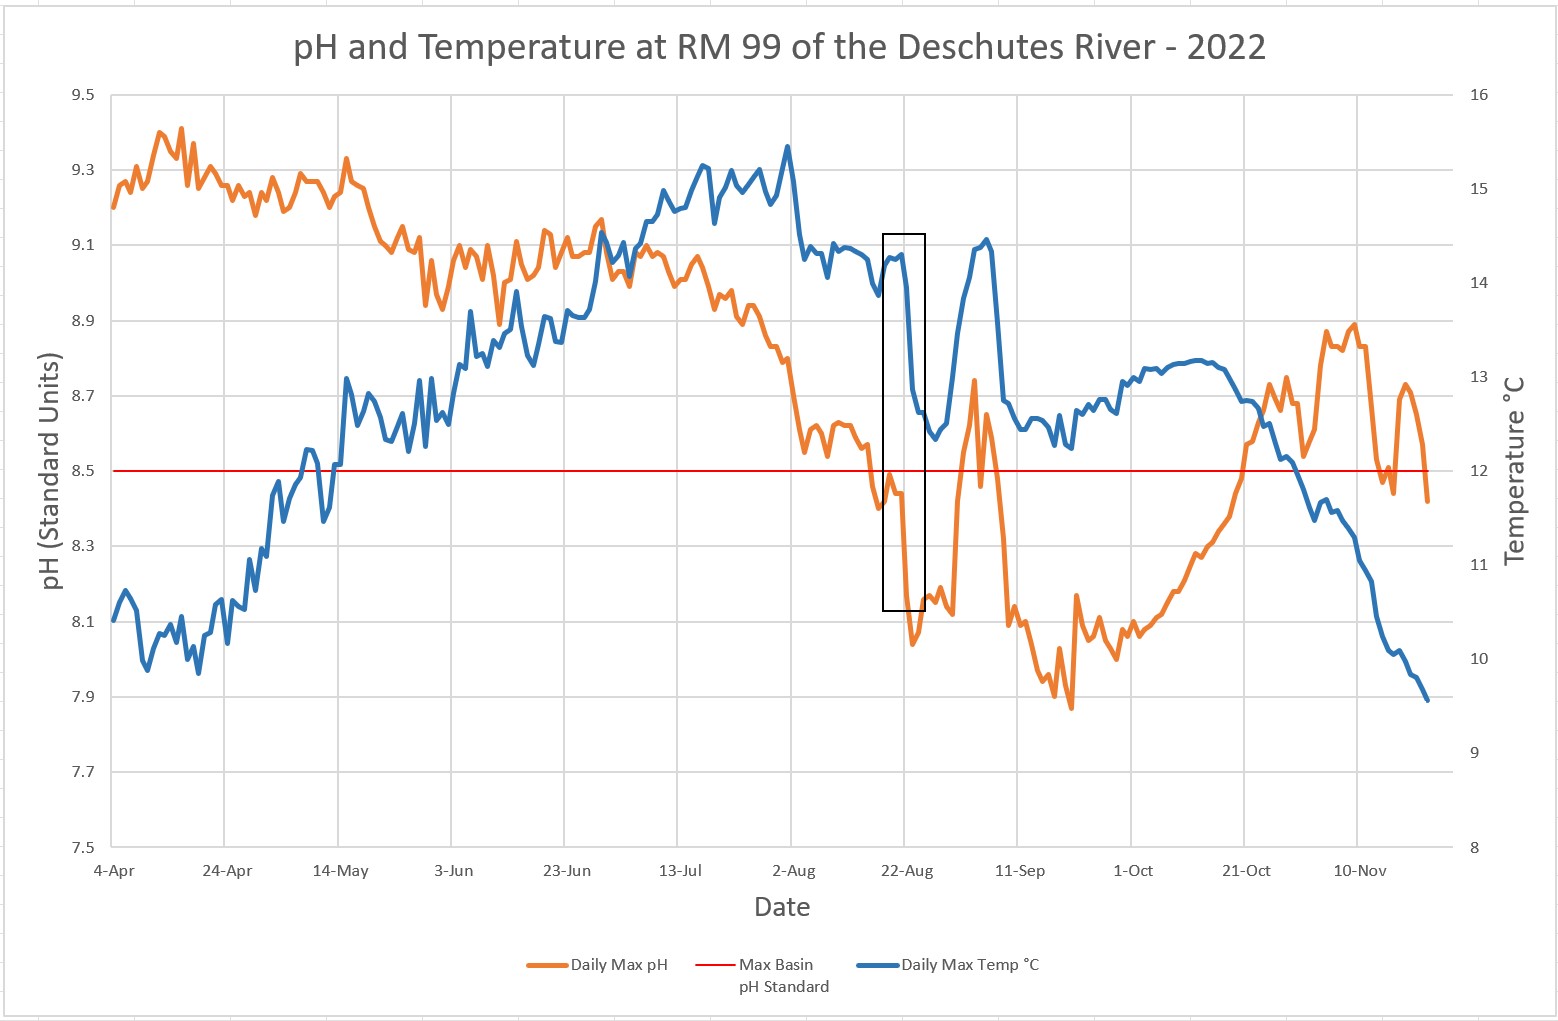
Figures 9-10. pH readings near Warm Springs (top) and Maupin (bottom) depicted by the blue lines in the two graphs above. The absolute maximum pH standard of 8.5 that applies throughout the Deschutes Basin is depicted by the red lines. At the Warm Springs site, the standard has almost been continuously in violation of the maximum standard since monitoring started in mid-March. At the Maupin station, aside from one day the pH standard has been violated on a daily basis with the natural daily swing that occurs in pH values due to photosynthetic activity in algae and aquatic plants.
Higher than average (over the last two decades) snowpack caused peak spring flows to be the highest since 2019 at 6800 cubic feet per second (cfs) just downstream of the Pelton-Round Butte (PRB) dam complex and 10,600 cfs near the mouth of the lower Deschutes on May 1, 2023. Since then, flows have reduced to about 3600 cfs just downstream of the PRB complex and 4200cfs near the mouth, which is fairly typical but lower than the median for this time of year.
Screenshots from the last 30 days discharge data in cubic feet per second (cfs) from the USGS Madras Gauge (just downstream of the Pelton-Round Butte complex) and Moody Gauge (near the mouth of the lower Deschutes) are shown in Figures 11 – 12 below.

Figure 11. Graph depicting discharge (cfs) at the USGS Madras gauge from May 29 to June 26.

Figure 12. Graph depicting discharge (cfs) at the USGS Moody gauge from May 29 – June 26.
Current hatches on the lower Deschutes:
Since 2013, DRA has collected macroinvertebrate hatch data to help track shifts in timing and abundance. The last entry into our lower Deschutes Hatch App was on 6/12/2023.

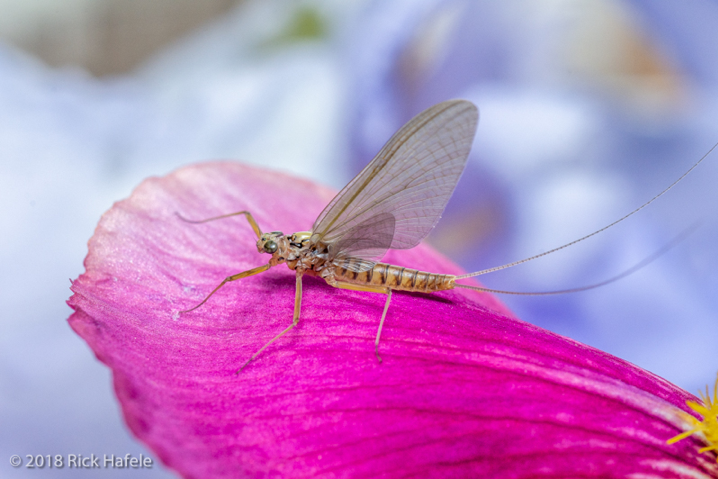
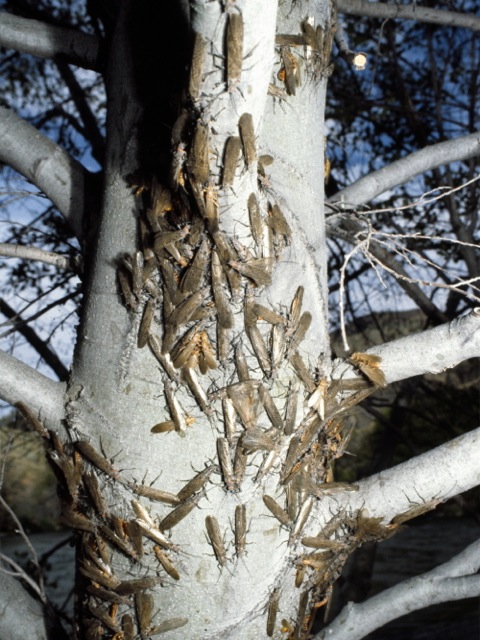
Figure 13. Net-spinning caddis adults. Photo credit: Rick Hafele
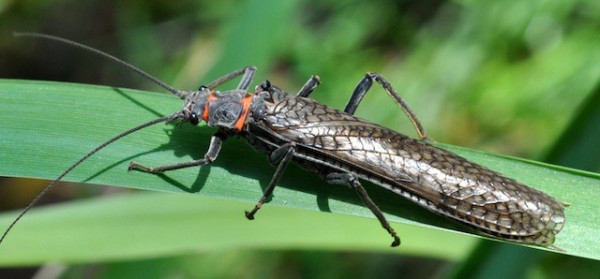
Entries from the month of June summarized in Table 3 below indicate that caddis flies are currently the primary hatch occurring on the lower Deschutes from Warm Springs to Sandy Beach. As of the last entry, net-spinning caddis (Hydropsyche sp. see Figure 13) were reported at a “high” (level 3 of 3) abundance and saddle-caddis (Glossosoma sp. see Figure 14) were reported at a “moderate” (level 2 of 3) abundance. The last of the golden stoneflies (family Perlidae, Figure 16) are laying their eggs with a reported “low” level of abundance. Craneflies were also reported at a “low” abundance (Figure 15).
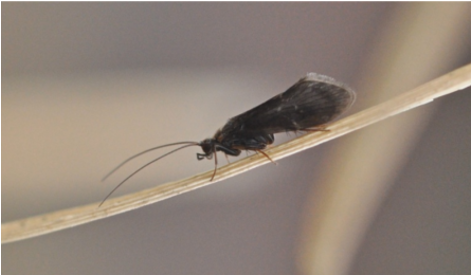
Figure 14. Saddle-case caddis adult. Photo credit: Rick Hafele
We highly encourage you to fill out this survey each time you are out on the lower Deschutes to keep your fellow anglers informed, and provide the DRA with invaluable data. For more information, please see our hatch app webpage. Prior to filling out your first survey, we ask that you watch the following identification training video.
| Date of last report | Hatch | Reach(es) | Abundance (1 “low” to 3 “high”) |
| 6/12/2023 | Golden Stonefly | Warm Springs – Trout Creek | 1 |
| 6/12/2023 | Net-Spinning Caddis | Warm Springs – Trout Creek Harpham – Sandy Beach | 3 |
| 6/12/2023 | Saddle-Caddis | Warm Springs – Trout Creek Harpham – Sandy Beach | 2 |
| 6/12/2023 | Cranefly | Warm Springs – Trout Creek Harpham – Sandy Beach | 1 |

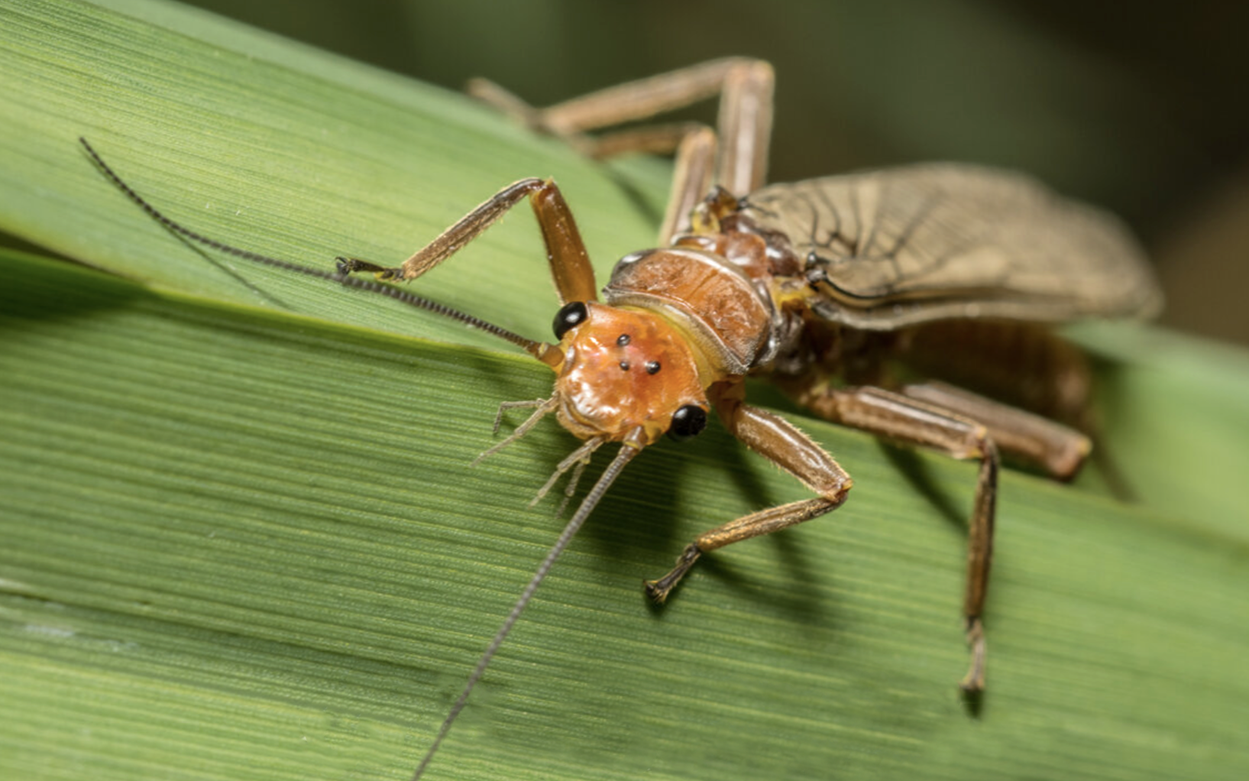
Figure 15. Cranefly adult. Photo credit: Rick Hafele

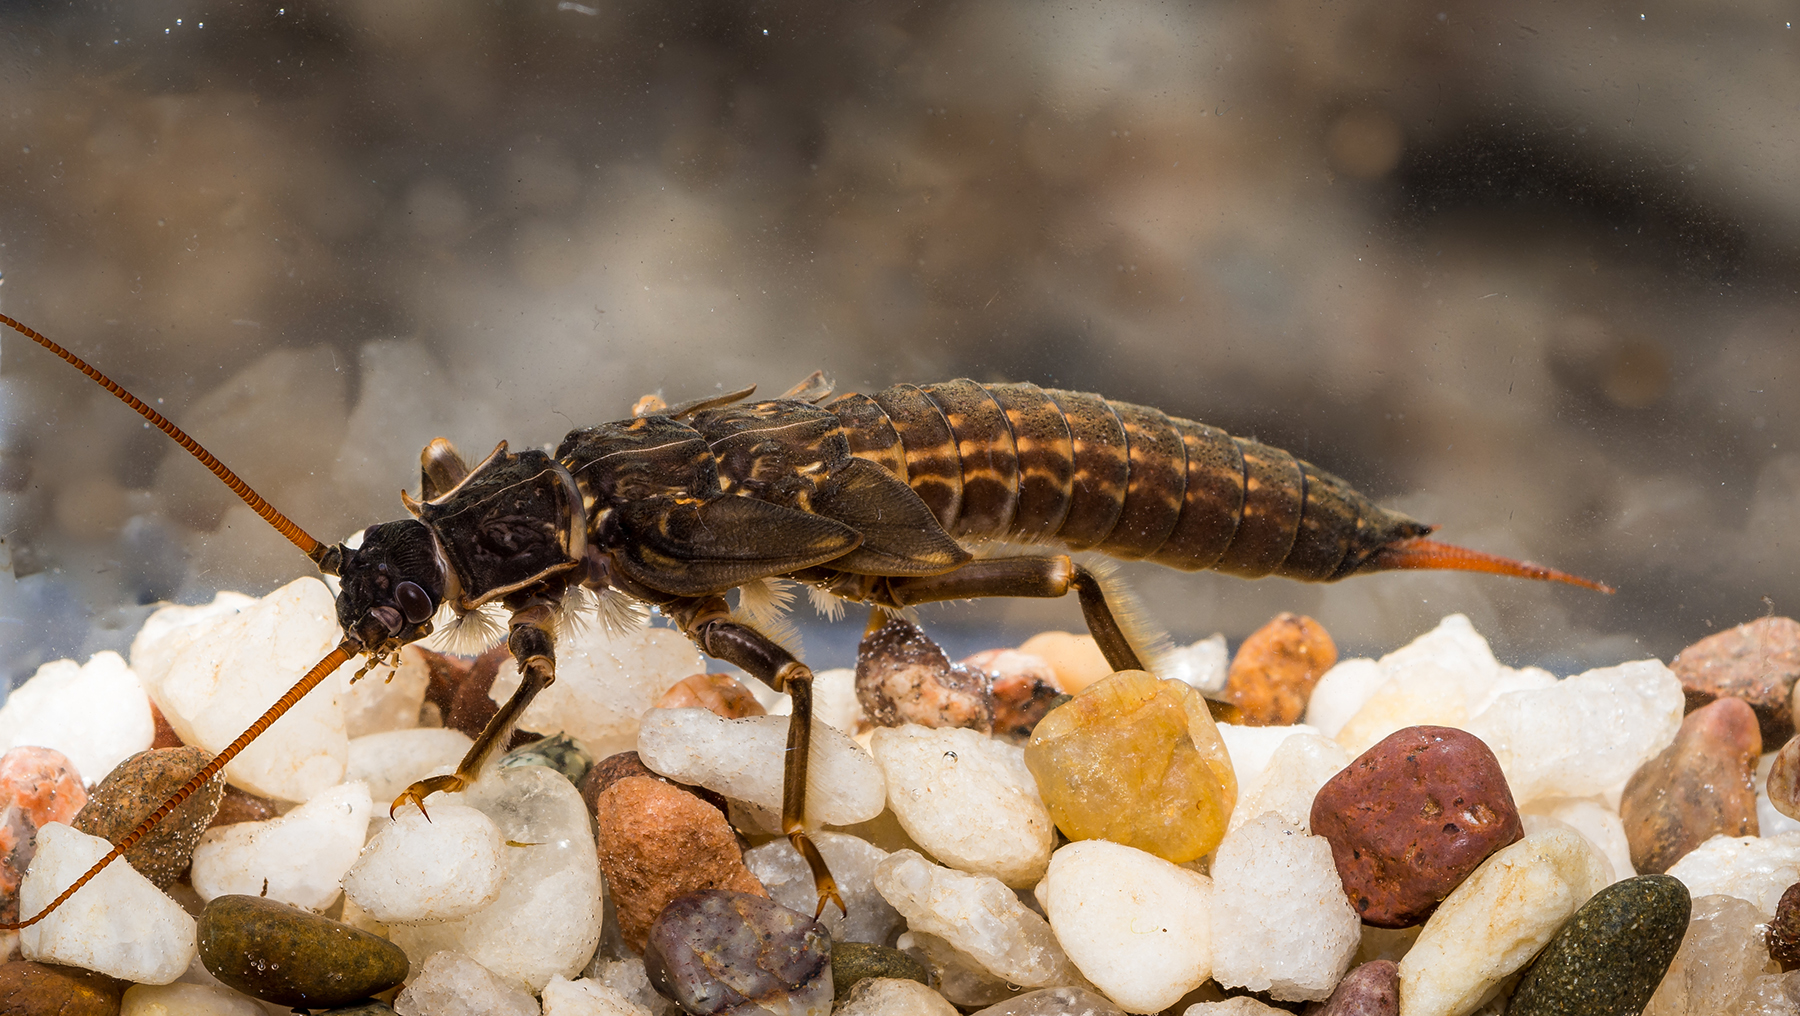
Figure 16. Golden stoneflies. Photo credit: Rick Hafele